Tag Archives: pinellas county

🏡 **The Housing Market in 2023: A Look at Pinellas County, Florida and Beyond**

The housing market in the United States has been a hot topic for years, and 2023 was no different. With a plethora of data available, it’s crucial to sift through the numbers and understand the trends that shaped the market. One way to do this is by focusing on specific regions, such as Pinellas County in Florida, to see how they compared to the national averages.

In 2023, Pinellas County saw a significant increase in active listings, jumping up by 29% from 43,158 in 2023 to 55,590 in January 2024. Time on the market also increased by 20%, going from 45 days in 2023 to 54 days in 2024. This rise in active listings and time the market might suggest a cooling of the market, potentially leading to a more balanced market for Buyers and Sellers alike. However, other factors must be considered.

Pending sales in January 2024 were down by 4%, with 17,919 compared to 18,581 in January 2023. On the other hand, sold homes were up by 4%, with 10,321 in 2024 compared to 9,968 in 2023. These numbers could indicate a shift in demand or Buyer behavior, which could have implications for the overall health of the market.

The average sold price in Pinellas County was up by 6%, reaching $456,537 in 2024 compared to $430,578 in 2023. This increase in price might be due to various factors, including a lack of inventory, increased demand, or other economic factors.

Looking beyond Pinellas County, the national housing market also saw some interesting trends in 2023. The National Association of Realtors reported that more than 85% of metro markets registered home price increases in the fourth quarter of 2023. This was largely due to a drop in the 30-year fixed mortgage rate from 7.79% to 6.61%. The lower interest rates made homes more affordable for many Buyers, leading to increased demand and higher prices.

Despite the overall positive trend, there were some areas that saw declines in home prices. In the fourth quarter, less than one-fifth of markets experienced home price declines, down from 17% in the third quarter. This could be a sign of a more balanced market, with prices stabilizing or even declining in some areas.

Housing affordability was another important factor in 2023. While the declining mortgage rates made homes more affordable for many buyers, there were still challenges for first-time buyers. Families typically spent 26.1% of their income on mortgage payments, down from 26.7% in the previous quarter but up from 24.2% one year ago. This could make it difficult for some families to afford a home, especially in high-cost markets. Overall, 2023 was an interesting year for the housing market in the United States. While there were some challenges, such as declining affordability and inventory shortages, there were also opportunities, such as low-interest rates and increasing home prices. As we move into 2024, it will be interesting to see how these trends continue to evolve and what they mean for buyers and sellers alike.

If making a move in 2024 is on your mind! make sure you call Price Group Realtors at Coldwell Banker we can guide you through this shifting market and offer some sound advice to keep your goals on track.

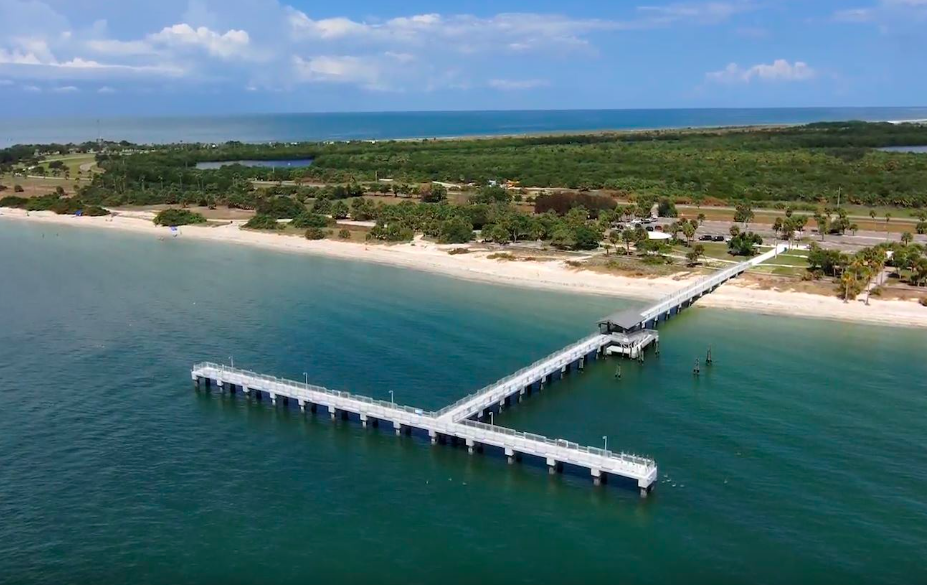
Unveiling Fort De Soto’s Magnificent New Bay Pier: A Destination Worth Exploring

Thanks to a combination of a generous federal grant and a voter-approved tax initiative, Fort De Soto is set to unveil its brand-new and vastly improved pier to the public next week. This exciting development will breathe new life into one of Pinellas County’s most beloved parks, and the community can come together to celebrate this milestone during the official ribbon-cutting ceremony at 11 a.m. on Thursday, September 28th. The ceremony will feature the presence of esteemed guests, including Parks & Conservation Resources Director Paul Cozzie and Board of County Commissioners Chair Janet C. Long.

The original Fort De Soto Park Bay Pier, a structure with historical significance dating back to 1943, had sadly deteriorated over the years, necessitating its removal. In its place now stands the state-of-the-art Bay Pier, which occupies the same location. This newly constructed pier boasts an array of modern features designed to enhance the visitor experience. The pier’s foundation is supported by sturdy concrete pilings, while concrete beams and a spacious concrete deck provide a stable and durable platform for visitors to enjoy.

One of the standout aspects of the new pier is its attention to detail, with the inclusion of low-level deck lighting ensuring that evening visits are just as enjoyable as daytime excursions. Additionally, fishing enthusiasts will appreciate the convenience of dedicated fish cleaning stations, making it easier to prepare their catch. Furthermore, a shaded area has been thoughtfully incorporated into the design to provide refuge for passengers waiting for the Egmont Key Ferry, which has temporarily relocated to the nearby Fort De Soto boat ramp.

This ambitious pier replacement project was initiated in 2019 and was made possible through a combination of funding sources. A substantial portion, amounting to $4,764,300, was allocated from the Penny for Pinellas infrastructure tax, showcasing the community’s commitment to enhancing its recreational amenities. In addition, a Federal Transit Administration grant contributed an impressive $1 million to the project, further demonstrating the collaborative efforts at play to create this new attraction.

Visitors eager to experience Fort De Soto’s new pier can find it on the eastern side of the park, situated at 3500 Pinellas Bayway South in the picturesque Tierra Verde area. While exploring this outstanding addition to the park, visitors can also take advantage of the many other attractions that Fort De Soto has to offer.

Fort De Soto Park is renowned for its natural beauty, with pristine beaches, lush landscapes, and a variety of outdoor activities. Nature enthusiasts can explore the diverse ecosystems within the park, while history buffs can delve into the historical significance of Fort De Soto itself, a former military outpost that played a pivotal role in American history.

Furthermore, Fort De Soto Park offers numerous amenities for visitors to enjoy, including picnic areas, playgrounds, and campgrounds. Whether you’re looking for a day of relaxation, a family adventure, or a chance to commune with nature, Fort De Soto Park has something for everyone. With the new Bay Pier now open to the public, there’s never been a better time to experience all that this stunning park has to offer.

After a fun day at the beach and the new pier why not head to downtown St. Pete and walk the pier https://stpetepier.org/

After falling in love with Pinellas County why not make it your new home and search for homes for sale on our site!

Townhouse in St. Petersburg – Crescent Heights

Check out this stunning Victorian Style townhouse in St. Petersburg in the heart of Crescent townhouse in st. petersburgHeights – just a couple of blocks from Crescent Lake Park! This 3 bedroom, 2.5 baths, 2 car garage, 1918 heated sq. ft. townhome has a large master suite has 2 walk-in closets, outdoor balcony and renovated master bath with glass shower. Second bath has been renovated with custom vanity and subway tile. This is one of only four townhomes in this residential neighborhood. Downtown St Pete is just minutes away by car or bike!


Want more information? Click here or contact David Price for more information. If you’re looking for homes in St. Petersburg, you can learn more about St. Pete’s historic neighborhoods here.

Canadian Vacation Home loans now available

Sunbelt Lending Services – John Fenech 727-827-1818: We are very excited to announce the news of our new “Canadian Vacation Home” program. Details will follow but I wanted to get the word out to you in case you have any Canadian buyers currently shopping for a 2nd home. Here are some basic guidelines to help you along until we get a flyer prepared:

• Single family homes or condominiums to loan amounts of $417,000
• Condominiums will use our limited review process
• 30% down payment
• 15 year fixed or 30 year fixed rate options available.
• No credit score needed
• Underwritten in our local operation center in Clearwater

This is great news for Canadian’s it’s been a long time since we have had a loan program that would allow Canadian Buyers to purchase other than with cash. When I first started in the real estate business back in 1997 (as a property manager for a vacation rental company) most of my clients on the beach were Canadian.

These changes show the confidence lenders now have in our market. Pinellas County has seem in most of these areas: St. Petersburg, Clearwater, Seminole, Largo, St. Pete Beach, Madeira Beach, Redington Beach, North Redington Beach, Indian Shores, Indian Rocks, Sand Key, Belleair Beach, Treasure Island 20%+ appreciation over the past 12 months. We also have inventory levels at an all time low which is just fueling the flames.

If you or someone you know if looking for home they should check out our website’s advanced MLS search :http://davidpricerealtor.com/homes-for-sale-search-advanced/

Or search our Condo Finder for downtown St. Pete: http://davidpricerealtor.com/condos/

Pinellas County Real Estate Statistics for July 2012

Click Here for MLS Date July 2012 Pinellas County Residential Real Estate Report

Residential sales were up just over 17%. Median sales prices were up 4.5% from $114,000 to $120,000 from July 2011 to July 2012. Listings continued to slide by almost 30% for the same time period.

Single family sales were up almost 19% from 759 to 900 over the last 12 months. This puts further pressure on the months-supply of inventory, dropping it 42%, from 6 months to 3.5 months. The median sale price increased by almost $15,000, from $122,000 to $137,600 over the last 12 months.

Condo sales were up almost 16% with the median sales price increasing by about 2.5% from July 2011 to July 2012. Condo listings fell by 25% pushing down the month’s supply of inventory to 6 months.

In the distressed market short sales made up 19% of total sales for July and foreclosures accounted for 14%. This was a significant shift from last year when the two were neck and neck. The median sales price of short sales over the last 12 months has dropped by almost $32,000 from $122,000 to $90,000. The median price of foreclosed properties and non distressed properties had a negligible drop over the last 12 months.

One bright spot has been the days on market for both short sales and foreclosures haves dropped by almost three weeks over the last four months. Hopefully this trend continues and indicates that banks are processing their inventory more efficiently. Unfortunately, the days on market for non-distressed properties has increased by two weeks over the same time period. This is most likely due to increased problems with appraisals, mortgage financing, and insurance.

Click Here for MLS Date July 2012 Pinellas County Residential Real Estate Report

Pinellas County Real Estate Statistics for March 2012

Click Here for a PDF report showing all charts and stats

For the month of March the single family market continues to be the strength of the market. While single family sales are down 3.1% from March 2011 to March 2012, sales are up almost 32% year to date, and the median sales price is up nearly $12,000 year to date. There was 21% increase in year over year sales in the condo market and as well as a 54% increase in month over month sales. However, even with a decrease in condo sales and in listings, there has still been a year over year decrease of 11% and a month over month decrease of 6.5% in the median sales price of condo’s in Pinellas County.

In the distressed market there have been ten straight months where short sales have continued to outpace foreclosure sales as banks are speeding up there short sale approval process. Of the 481 distressed property sales last month 58% were short sales and 42% were bank-owned sales. To give some perspective on how much the numbers have improved in March 2011 foreclosure accounted for 70% of the distressed market and short sales accounted for 30%.

Financing continues to be a problem as cash buyers have accounted for 60% to 65% of the market over the last year. Financing will be a key factor over the next year as the real estate market continues its recovery. Sellers will need to feel confident they can get financing to buy a new house before they will put their current house on the market.

According to David Bennett, President and CEO of the Pinellas Realtor Organization, “The pendulum is just starting to swing back towards a seller’s market. With the number of listings so low sales prices have been starting to increase, hopefully fewer homeowners are underwater and more of them will be able to sell.

Click Here for a PDF report showing all charts and stats

Pinellas County Real Estate Statistics for February 2011

February 2011 statistics Pinellas County Click Here to download

The real estate market in Pinellas County is showing more signs of stabilization. For the month of
February sales were up for both single family and condo, likely a result of the increases in pending
sales in January. Listings were down across the board and the median sales price remains relatively
unchanged. During the first half of 2010 the first time homebuyer tax credit was impacting closings
while the later tax credit was beginning to affect pending contracts. Since there is no longer a tax
credit, we might have expected sales and contracts to be lower; however sales were up nearly 25%
and pending contracts increase by 17%. Pinellas County’s fire sale prices and low interest rates are
the big driver now in spite of the continued high jobless rate.

For February 2011 single family home sales were up nearly 20% as compared to the same time period
last year. The median sales price for single family homes was down $30,000 or 30% from February
2010, however it remained nearly constant from last month. Listings for single family homes fell 3%
from February 2010. In the first two months of 2010 the median sales price was stagnant, but saw a
modest jump in March.
Condo sales were up almost 24% from February 2010 to February 2011. The median sales price
trended similar to single family homes, declining 28% for the month of February, as compared to
February 2010. However, there was a modest increase from January 2010. Condo listings were down
about 8% from February 2010 to February 2011. This also marks the seventh straight month condo
listings have decreased.

Overall residential market sales increased by almost 25% from February 2010 to February 2011, and
were up 13% from month to month. Overall residential listings were down about 5% since February
2010. The median sales price for residential properties plummeted nearly 29% year over year making
Pinellas County one of the best bargains in the nation.
Cash is still king for the local market, indicating that likely many sales are to investors. There should
start being some modest increases in sales price as the decrease in listings creates more upward
pressure on the sales price. Another bright spot in the market for the month was the modest increase in
non-distressed sales versus a relatively stagnant number of distressed sales.

February 2011 statistics Pinellas County Click Here to download

Pinellas County Real Estate Statistics for January 2011

Click to download Jan 2011 MLS state from Pinellas County FL

Real estate statistics for Pinellas County in January are showing mixed signals. While the volume of sales showed a big
increase over last year, the median price on all residential properties dropped an equally large amount.
January is traditionally one of the slowest months for closings due to the holiday effect in November
and December, so it was unusual to see the numbers of sales climb substantially. January 2011 was
the best January for closings since 2006. However, the number of contracts pending fell slightly. Keep a close eye over the next few months to see how many of these contracts will close.

January residential sales were up over 27% from January 2010 to January 2011. However, the month
to month increases slowed a bit due to the unusually high number of sales in December. The median
sales price for residential sales in January dropped 28% or $36,000 when compared to the same time
period last year.
Single family sales were up almost 36% in January 2011, compared to January 2010. Sales were
down from December 2010 which was not surprising. The median sales price continued its decline
from $135,000 for 2010 to $100,000 in January. The number of pending contracts is about the same
as a year ago and listings remained relatively stable on a year over year basis.
Condo sales in January were over 15% higher than the same time period last year. Median price in
2010 was $114,000, and following along with the single family trend, the January 2011 median price
fell to $75,500. Comparing January 2010 to January 2011 the median sales price for condos dropped
almost 33%, from $113,000 to $75,500. Condo listings dropped nearly 6% and the pending contracts
also dipped by more than 5% since January 2010.
Other key numbers for the month:
ď‚· For January 2011 the distressed market accounted for just 47% of all sales, a decrease of 15%
from last year. Currently 48% of all residential listings are distressed properties.
 Overall, the months’ supply of inventory is now about 12 months, with more than 10 months
for single family homes and over 14 months for condos. The supply is about 4 months for
distressed properties and over 11 months for non-distressed.
ď‚· The median price for bank owned properties is $60,000 ($101,000 a year ago) while non-bank
properties, it is $144,000 ($137,000 last year).
With financing still predominately all cash and the number of foreclosures and short sales on the
market, we are likely to be working in this market for 2011. By now many Realtors have figured out
how to co-exist with the distressed market. Since 76% of contracts pending are foreclosures or short
sales, we can see that the biggest headache comes from short sales.

Click to download Jan 2011 MLS state from Pinellas County FL