
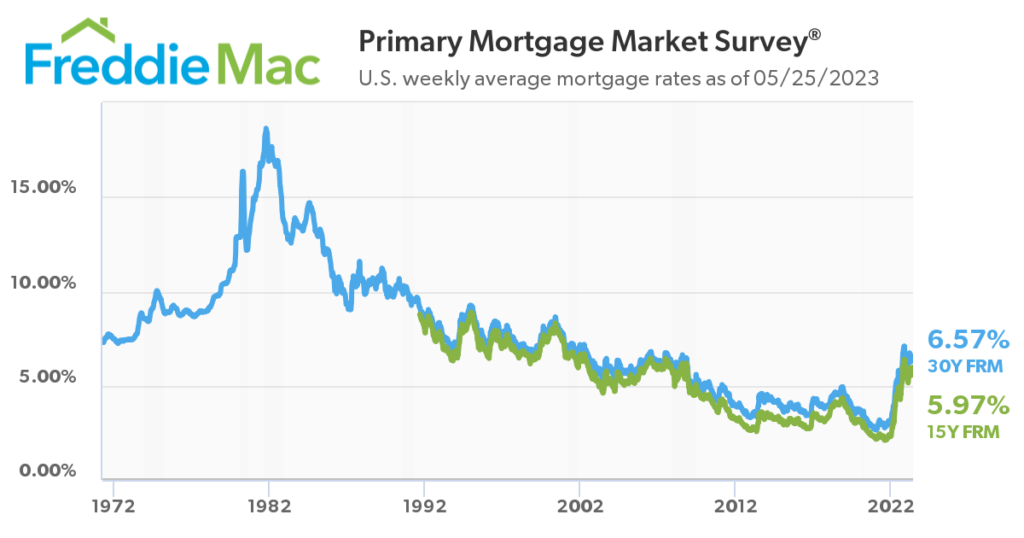
historical mortgage rates from 1980 to the present day:
1980-1990:
- In the early 1980s, mortgage rates were extremely high due to a combination of inflation and the Federal Reserve’s efforts to curb it. Rates peaked in 1981, with the average 30-year fixed mortgage rate reaching around 18.45%.
- Throughout the 1980s, mortgage rates gradually declined but remained relatively high compared to today’s standards. By the end of the decade, rates were around 10-11%.
1990-2000:
- The 1990s witnessed a downward trend in mortgage rates. As the economy stabilized, inflation moderated, and the Federal Reserve adopted a more accommodative stance, rates began to decline.
- By the mid-1990s, 30-year fixed mortgage rates had dropped to around 7-8%. Towards the end of the decade, rates dipped below 7%, reaching approximately 6.5% by the year 2000.
2000-2010:
- In the early 2000s, mortgage rates remained relatively low, hovering around 6-7%.
- Following the burst of the dot-com bubble and the events of September 11, 2001, the Federal Reserve initiated a series of rate cuts to stimulate the economy. By mid-2003, 30-year fixed mortgage rates had fallen to approximately 5%.
- From 2003 to 2006, mortgage rates remained relatively stable, averaging around 5-6%.
- However, the housing bubble began to form, leading to the subprime mortgage crisis. As the crisis unfolded in 2007 and 2008, mortgage rates increased due to market uncertainties. Rates peaked at around 6.5-7% in late 2008.
2010-2020:
In response to the financial crisis, the Federal Reserve implemented an ultra-low interest rate policy to stimulate the economy. Mortgage rates reached historic lows during this period.
From 2010 to 2020, mortgage rates remained below 5% for most of the time, often fluctuating between 3-4%.
- In 2020, mortgage rates hit record lows as the COVID-19 pandemic impacted global economies. Rates fell below 3% for 30-year fixed mortgages, reaching as low as 2.65% in December 2020.
- Throughout 2021, mortgage rates remained relatively low, but started to gradually increase due to improving economic conditions and inflation concerns.
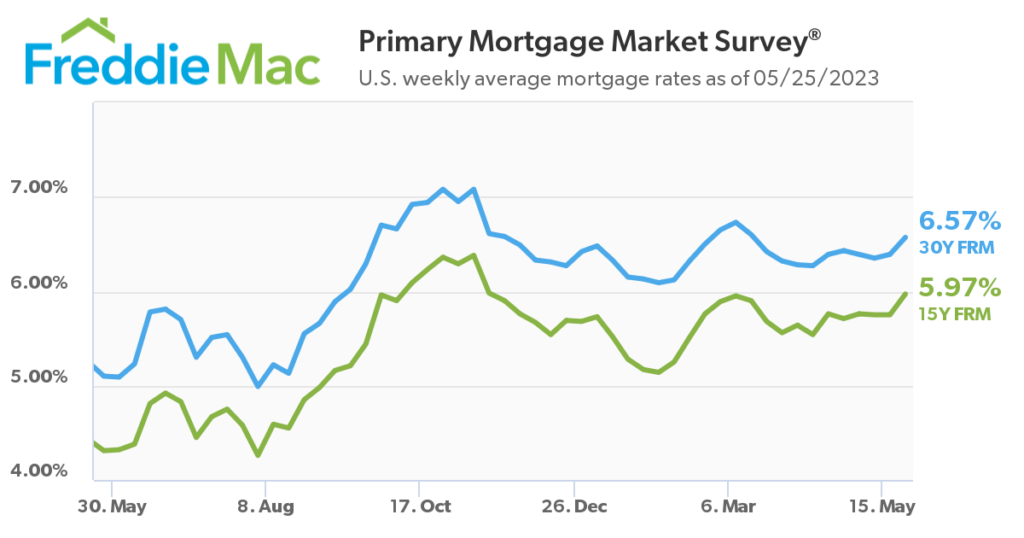
- In 2022 the FED begin raising interest rates to battle inflations, the FED has raised the FED funds rate from 0% to 5% through mid 2023 which has pushed mortgage rates to 6.5-7% on a 30 year mortgage. As you can see by the chart below the 30 year fixed mortgage rates have been range bound for the past 7 months in the 6-7% range.
When inflation starts coming down (and it is), central banks may consider reducing interest rates to stimulate economic growth. Lower interest rates can encourage borrowing and investment, which can help boost spending and economic activity. However with the current jobs numbers and a strong consumer I don’t see the FED needing to stimulate the market, if anything I can see the FED pushing interest rates up another .25% in June to put more pressure on the market.
It is important to note that central banks, including the Federal Reserve, consider a wide range of economic factors when making decisions about interest rates. Inflation is just one of the factors taken into account. Other factors include employment levels, GDP growth, financial market conditions, and global economic trends.
The stock and bond markets are predicting rate cutes by the end of the year but time will tell.
How has mortgage rates effected a Buyers ability to purchase a home?
The formula takes into account the loan amount, interest rate, and loan term to determine the monthly payment. Here are the PI payments for a $500,000 mortgage at 4%, 5%, 6%, and 7% interest rates:
- Mortgage at 4%: Using a loan amortization calculator, the PI payment for a $500,000 mortgage at a 4% interest rate over 30 years would be approximately $2,387.08.
- Mortgage at 5%: Using the same calculator, the PI payment for a $500,000 mortgage at a 5% interest rate over 30 years would be approximately $2,684.11.
- Mortgage at 6%: For a $500,000 mortgage at a 6% interest rate over 30 years, the PI payment would be approximately $2,998.87.
- Mortgage at 7%: Lastly, for a $500,000 mortgage at a 7% interest rate over 30 years, the PI payment would be approximately $3,331.06.
As you can see from the lower range of 4% to 7% on the high end of the range, the monthly cost is almost $1,000 higher or 24% more per month. This is being absorbed by Buyers because employees have seen increases in income.
Some expected a housing crash with these interest rate changes however that’s not want we have seen at this point, homeowners who locked into low rates during the pandemic are holding on to their sub 4% (some below 3%) mortgage rates which is keeping listing inventory low.
Real estate is a buy and hold game, buy a home you can afford and in 10-20 years it will have increased in value! There are better times to buy and sell but we all need a roof over our heads and if you don’t have to sell time is always on your side.